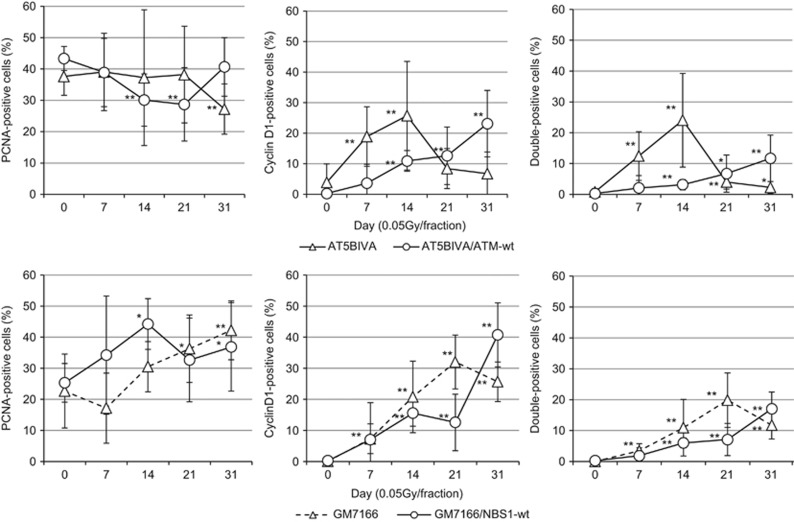
Figure 3.
Kinetics of PCNA and cyclin D1 response following low-dose FR in ATM- and NBS1-deficient cells. Cells positive for PCNA (left panel), cyclin D1 (center panel) and both (right panel) were scored 24 h following the indicated FR exposure. Data for AT5VIBA, AT5VIBA/ATM-wt, GM7166 and GM7166/NBS1-wt cells exposed to 0.05 Gy fractions are shown. Asterisks indicate a significant increase in staining cells compared with control cells.

