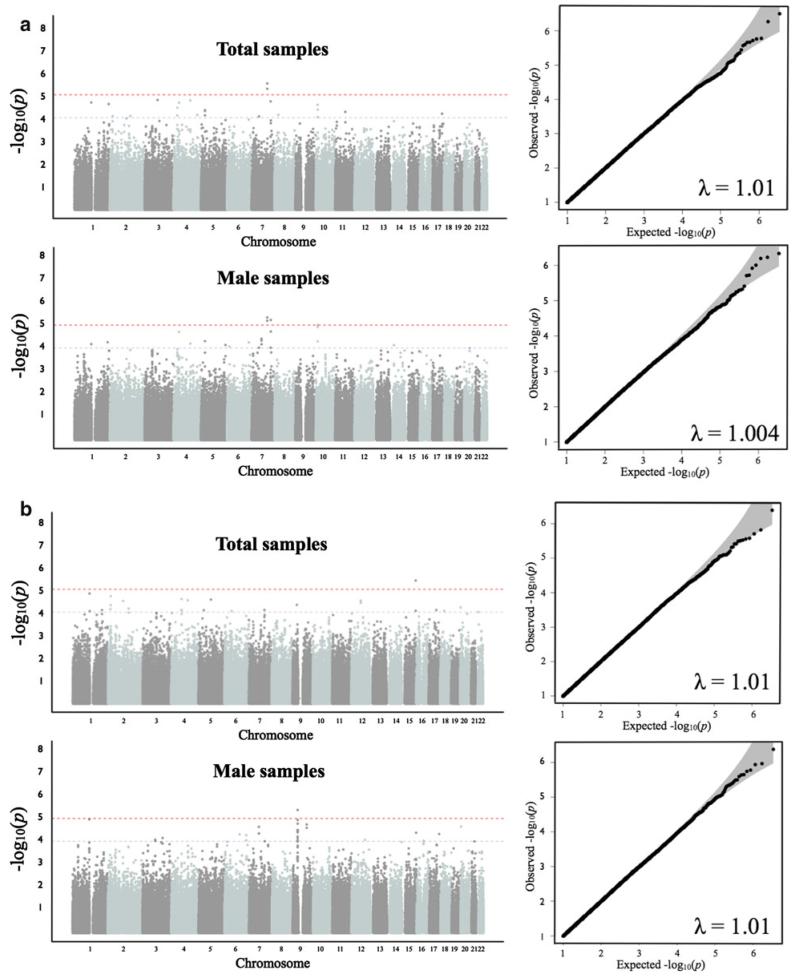
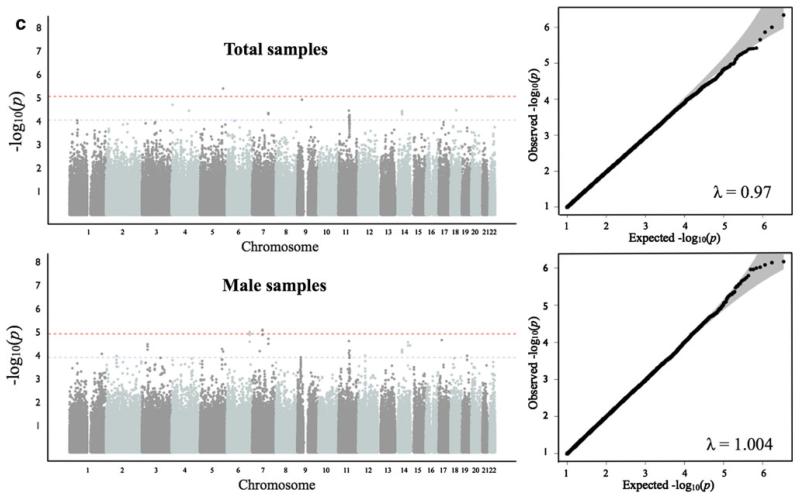
Fig. 1.
Chromosomal and QQ plots for smoking behaviors. Statistical significance of each SNP is scaled as −log10 (p value). Red dotted line indicates threshold in Discovery sample (p < 10—5), and blue dotted line indicates p value 10—4. We plotted the observed −log10-scaled association results versus −log10-scaled expected association results in QQ plots. Chromosomal and QQ plots for ND phenotype (a), SI-1 phenotype (b), and SI-2 phenotype (c)


