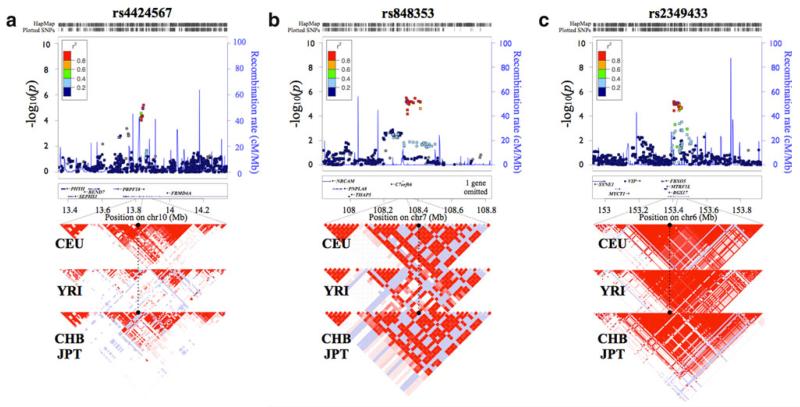
Fig. 2.
Regional plots of significantly associated SNPs. We show the locus ±500 kb around the lead associated SNP. Statistical significance of each SNP is scaled as −log10 (p value) along the chromosomal position (NCBI build 36). The lead SNP at each locus is shown in a purple diamond. Direct genotyping in SNP genotyping chip is in a circle and imputed SNP in a square. Pairwise correlation between the lead and other SNPs at locus is shown on a scale from minimum (blue) to maximum (red). Estimated recombination rates from HapMap are plotted in aqua. The box below the association signals contains gene information within each locus. The direction of each gene is shown as a left or right arrow, and exon is shown as a filled square, whereas intron is indicated as a line. The LD pattern is at the bottom of each regional plot. A dotted line indicates the ±50-kb boundary from the lead SNP. The black circle stands for the position of the lead associated SNP. We show the LD pattern drawn from HapMap data for the European (CEU), African (YRI), and Asian (CHB/JPT) populations. R2 of SNPs is drawn on a scale from minimum (white) to maximum (red). Regional association plot for ND-associated SNPs, rs4424567 (a) and rs848353 (b) and SI-associated SNP, rs2349433 (c)

