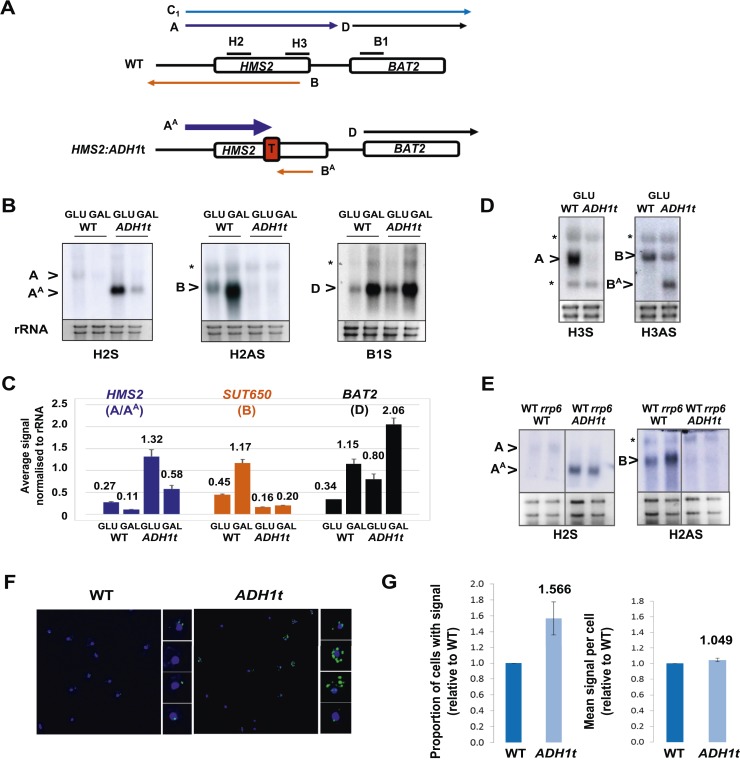
Figure 3. HMS2 mediates transcriptional interference of BAT2.
(A) Schematic showing constructs and transcripts at the WT HMS2:BAT2 locus and after insertion of the ADH1 terminator (T). (B) Exemplarily autoradiographs of Northern blots of total RNA prepared from the constructs in (A) cultured in glucose or after 60 min in galactose probed for the HMS2 sense, the SUT650 antisense, and the BAT2 sense transcripts. (C) Quantitation of autoradiographs showing average signal normalized to rRNA for the transcripts indicated. n = 2, errors are SEM, Figure 3—source data 1A. (D, E) Exemplarily autoradiographs of Northern blots of total RNA prepared from the strains indicated containing the constructs in (A) cultured in glucose probed for the regions indicated. (F) Visualizing HMS2 sense transcripts using fluorescence in situ hybridization (FISH) in single cells using a combination of four, 50 nt DNA probes labelled with four Cy5 fluorophores (green, sense), hybridised to paraformaldehyde-fixed yeast cells. The nucleus is shown in blue (DAPI). Smaller boxes are zoomed images of select cells in the field of view. The images presented here are part of a larger data set. (G) The graphs represent the proportion of sense-expressing cells in the WT compared to HMS2:ADH1t and the mean signal per cell. A total of ≈500 cells were assessed for each strain. Error bars are SEM; n = 4, Figure 3—source data 1A,C).
DOI: http://dx.doi.org/10.7554/eLife.03635.011

