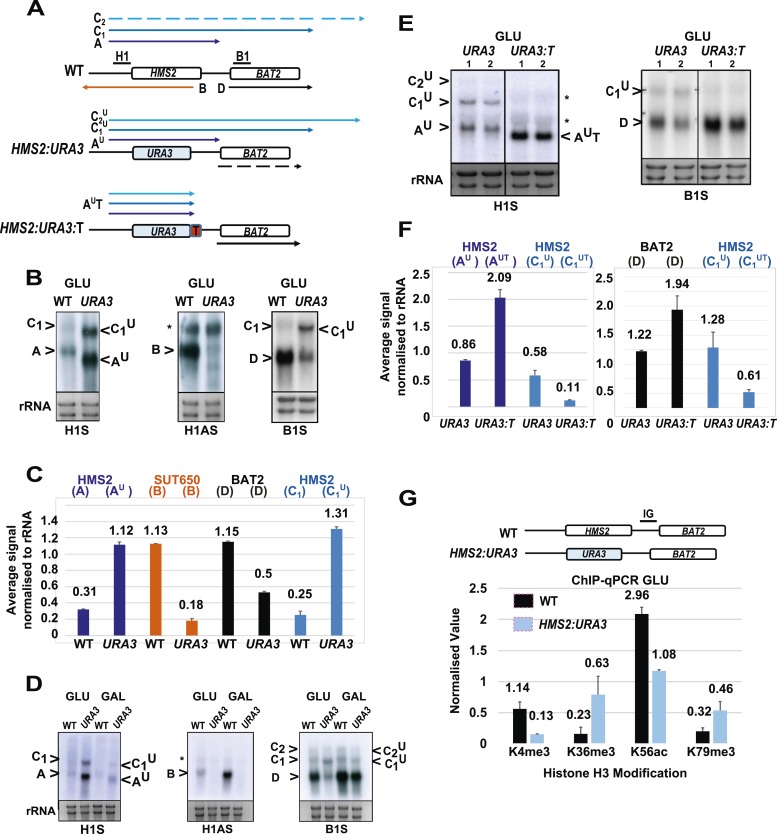
Figure 4. SUT650 antisense transcription insulates BAT2 from interference by HMS2.
(A) Schematic showing transcripts after replacement of the HMS2 coding region (top) with the URA3 coding region (middle) or URA3 plus a transcription terminator (T) (bottom). Transcripts resulting from the URA3 insertions are identified with a superscript U or UT. (B, D, E) Northern blots of total RNA in strains with the HMS2 coding region replaced with the URA3 coding region in glucose (B), after 1 h in galactose (D) or in glucose with a terminator (T) inserted after URA3 (E). In (E), samples were run on the same gel but intervening tracks removed. (C) Quantitation of transcripts for WT and HMS2:URA3 in glucose, n = 2, errors are SEM, Figure 4—source data 1A. (F) Quantitation of transcripts in (E) for HMS2:URA3 and HMS:URA3:T in glucose, n = 2, errors are SEM, Figure 4—source data 1B. (G) Chromatin immunoprecipitation (ChIP-qPCR) at the HMS2:BAT2 intergenic region (IG) in strains indicated using antibodies with the specificities indicated. Signals were normalized to Histone H3 and then the signal in the coding region of TUB2. Error bars are SEM for n = 2; Figure 4—source data 2.
DOI: http://dx.doi.org/10.7554/eLife.03635.013


