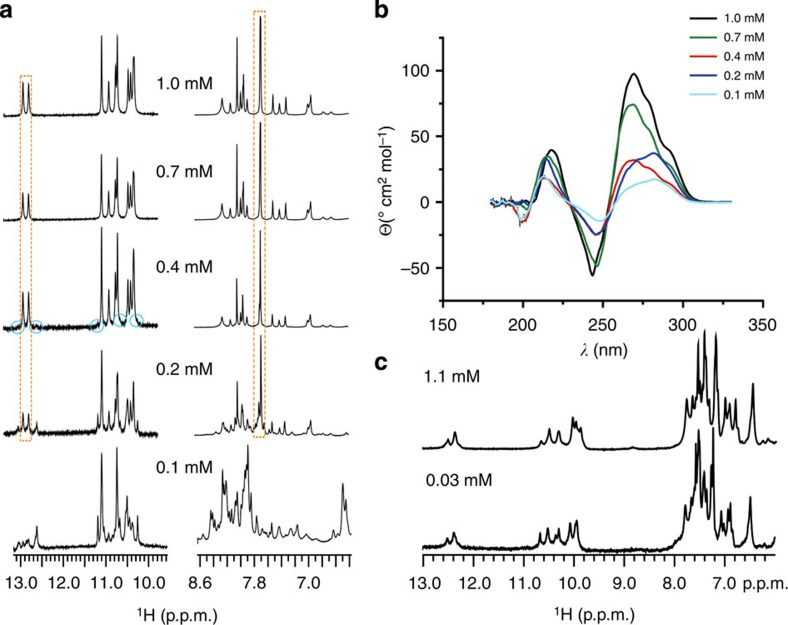
Figure 2. Concentration-dependent 1H NMR and CD spectra.
(a) 1H NMR spectra of VK1 at 0 °C, pH 6 and different oligonucleotide concentrations indicated next to individual spectra. The most characteristic signals of the VK1 fold are marked with a dashed square. The blue circles mark small signals that appear at 0.4 mM concentration and indicate a different fold. (b) CD spectra of VK1 at different concentrations per strand. The spectra were recorded in a 0.25-cm path-length cell at 0 °C, 100 mM LiCl and pH 6. (c) 1H NMR spectra of VK2 at 0 °C, pH 6 and 0.03 and 1.1 mM oligonucleotide concentrations.

