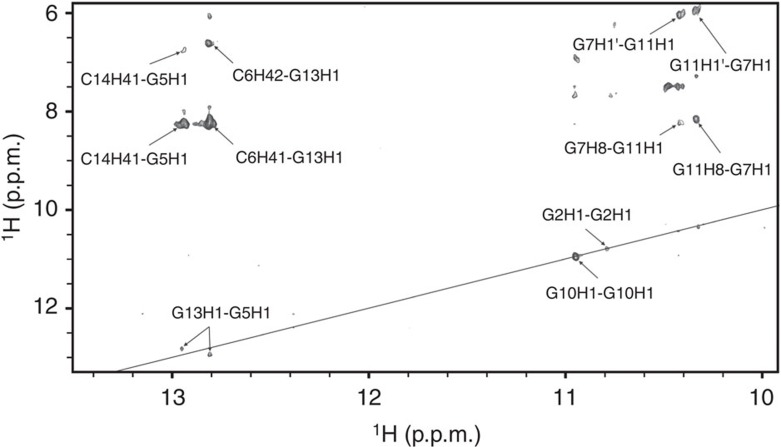
Figure 5. The imino–imino region of 15N-edited and 15N/13C-filtered NOESY spectrum.
Data were acquired on a sample that contains an equimolar mixture of unlabelled and uniformly 13C, 15N-GC-labelled VK1 oligonucleotides. The spectrum was recorded at 0.9 mM concentration per strand, 0 °C, pH 6 and mixing time of 100 ms. Assignment of individual cross-peaks is indicated. The position of a diagonal in a corresponding standard 1H–1H NOESY spectrum is shown as a straight line.

