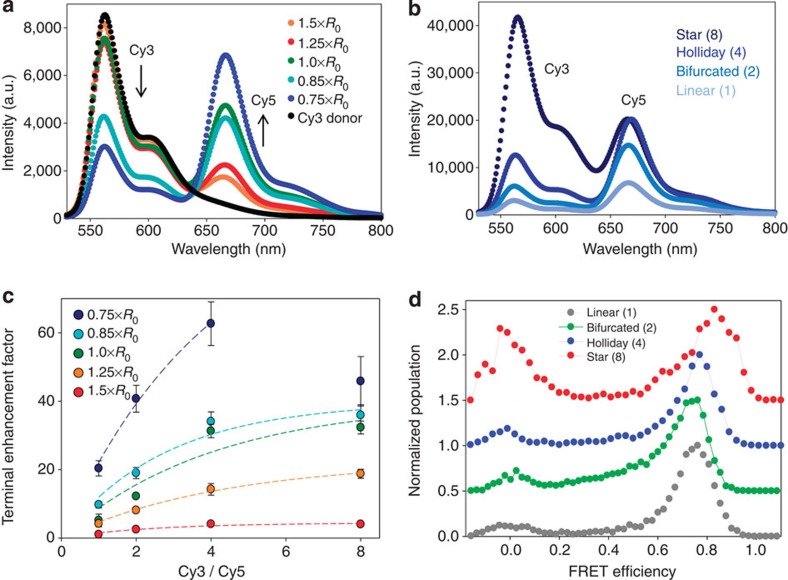
Figure 3. Two-dye single-FRET step systems.
(a) Representative spectra excited at 515 nm, showing the effect of altering Cy3–Cy5 donor–acceptor spacing in the linear system as a function of R0 (~54 Å). The direct Cy3-only emission in each was used to normalize the data. (b) Representative spectra from linear, bifurcated, Holliday junction and eight-arm star Cy3–Cy5 constructs where donor–acceptor spacing was maintained at ~0.75 × R0. Data were normalized to the Cy5 alone emission. (c) Plot of the Cy5 terminal enhancement factor (TEF) as a function of the number of Cy3 donors per Cy5 acceptor for each of the donor–acceptor spacings as compared with the initial 1.5 × R0 Cy31→Cy5 system. Data are averaged from at least three independently assembled constructs and are plotted with the s.d. Trend lines are added to aid the eye. (d) Representative single-pair or spFRET histograms for all 0.75 × R0 constructs, see Supplementary Note 4. The maximum number of FRET events for each histogram has been normalized to unity. The green, blue and red curves are stacked upward for comparative presentation. Note the growth of the zero-FRET efficiency population (left) in the star structure and the shift to higher efficiency (right) from the linear to the star structure.

