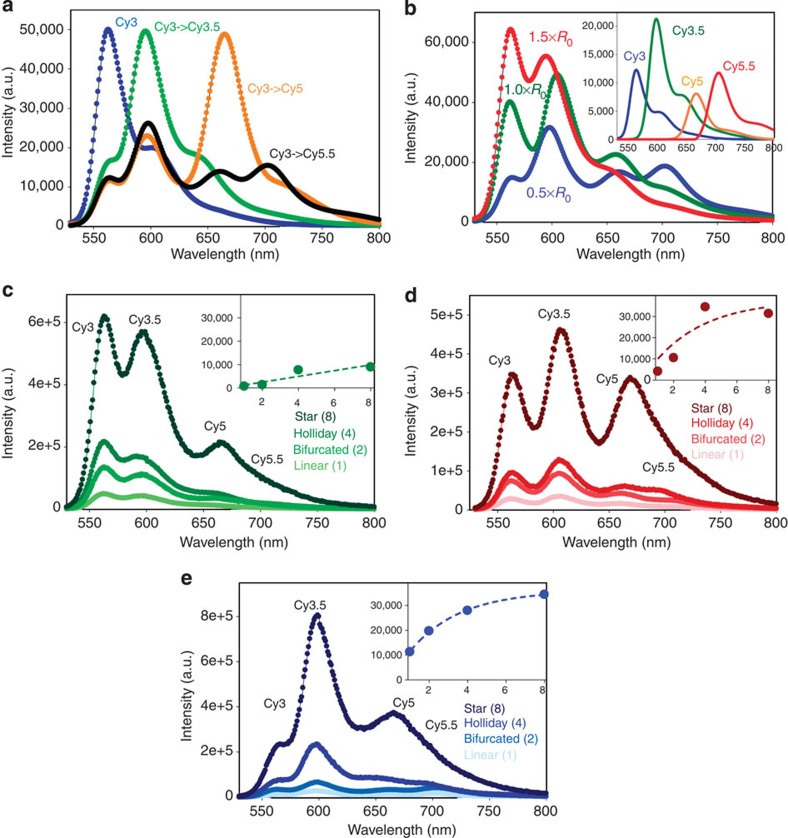
Figure 4. Four-dye photonic wire systems.
(a) Representative data showing the spectral evolution of the 0.5 × R0 linear [Cy3→Cy3.5→Cy5]1→Cy5.5 system as consecutive acceptor dyes are added to the initial Cy3 donor. (b) Representative comparative spectral data for the 0.5 × , 1.0 × and 1.5 × R0 linear systems. Data were normalized to the direct Cy5.5 emission at the same excitation. Inset, decomposed individual component spectra for the 0.5 × R0 linear system. Representative spectra showing the FRET evolution of the (c) 1.5 × R0, (d) 1.0 × R0 and (e) 0.5 × R0 systems as the number of arms for each was increased from one to eight. The insets in panels c–e plots the increase in Cy5.5 sensitized emission as a function of the number of arms, all on the same scale. For comparison these data are all normalized to the direct Cy5.5 excitation component.

