Table 2.
The Enriched scaffolds having P < 0.01 and enrichment factor >10 that are corresponding to 184 actives.
| Scaffolds | Matches in Actives (10735) |
Matches in Inactives (331528) |
Actives (without motif) |
Inactives (without motif) |
Chi-square | P-value | Enrichment factor |
|---|---|---|---|---|---|---|---|
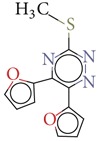
|
13 | 1 | 10722 | 331527 | 370.9611 | 1.16E − 82 | 401.48 |
|
| |||||||
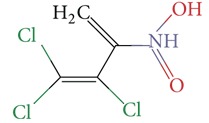
|
16 | 4 | 10719 | 331524 | 388.9498 | 1.40E − 86 | 123.53 |
|
| |||||||
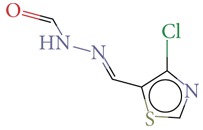
|
11 | 4 | 10724 | 331524 | 243.3006 | 7.50E − 55 | 84.93 |
|
| |||||||
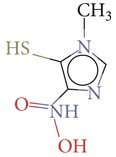
|
20 | 11 | 10715 | 331517 | 384.4568 | 1.33E − 85 | 56.15 |
|
| |||||||
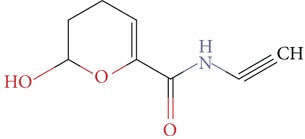
|
21 | 20 | 10714 | 331508 | 312.045 | 7.83E − 70 | 32.43 |
|
| |||||||
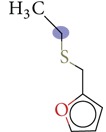
|
28 | 32 | 10707 | 331496 | 374.2882 | 2.18E − 83 | 27.02 |
|
| |||||||

|
21 | 27 | 10714 | 331501 | 260.64 | 1.24E − 58 | 24.02 |
|
| |||||||
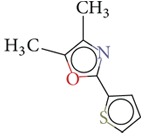
|
12 | 21 | 10723 | 331507 | 119.9333 | 6.54E − 28 | 17.65 |
|
| |||||||
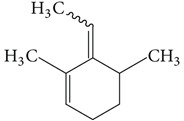
|
12 | 30 | 10723 | 331498 | 89.44623 | 3.15E − 21 | 12.35 |
|
| |||||||

|
30 | 92 | 10705 | 331436 | 184.8912 | 4.15E − 42 | 10.0 |
