Figure 1.

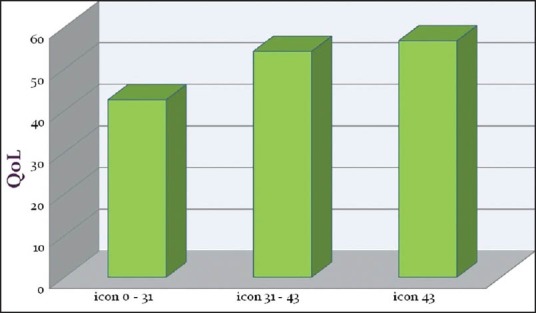
Bar diagram of quality of life levels for three severity grades of malocclusions based on the index of complexity, outcome and need

Bar diagram of quality of life levels for three severity grades of malocclusions based on the index of complexity, outcome and need