
Figure 2.
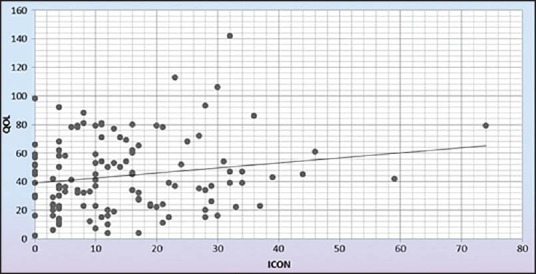
Scatter plots of total oral health-related quality of life versus index of complexity, outcome and need for the 129 students
Official websites use .gov
A
.gov website belongs to an official
government organization in the United States.
Secure .gov websites use HTTPS
A lock (
) or https:// means you've safely
connected to the .gov website. Share sensitive
information only on official, secure websites.
Scatter plots of total oral health-related quality of life versus index of complexity, outcome and need for the 129 students