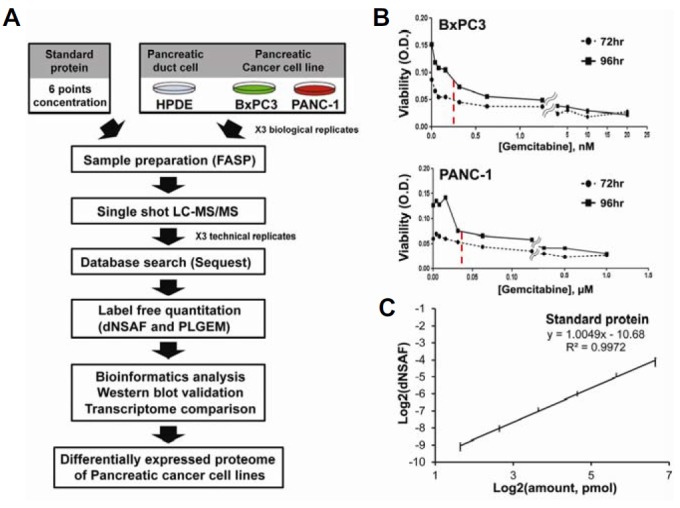
Fig. 1.

An overall flow-chart of the proteomics approach. (A) An overall schematic of this proteomics study. (B) IC50 values against gemcitabine. To test for chemoresistance of BxPC3 and PANC-1 cells against gemcitabine, IC50 assays were performed after the treatment of cells with gemcitabine for 72 and 96 h. The x- and y-axes represent the concentration of gemcitabine and cell viability (O.D.), respectively. The red dotted line indicates the average IC50 at two time points for each cell line. (C) Evaluation of linearity. To check the linearity of our quantitative platform, a linear response curve was drawn for six different amounts of ovalbumin (3.125, 6.25, 12.5, 25, 50, and 100 pmol) spiked into the same quantity of cell ly-sates. All samples were analyzed in technical triplicates and error bars represent the linear response curve for each point. The x- and y-axes represent the log2 value for the spiked amounts of ovalbumin and dNSAF, respectively. The R2 value was 0.9972.
