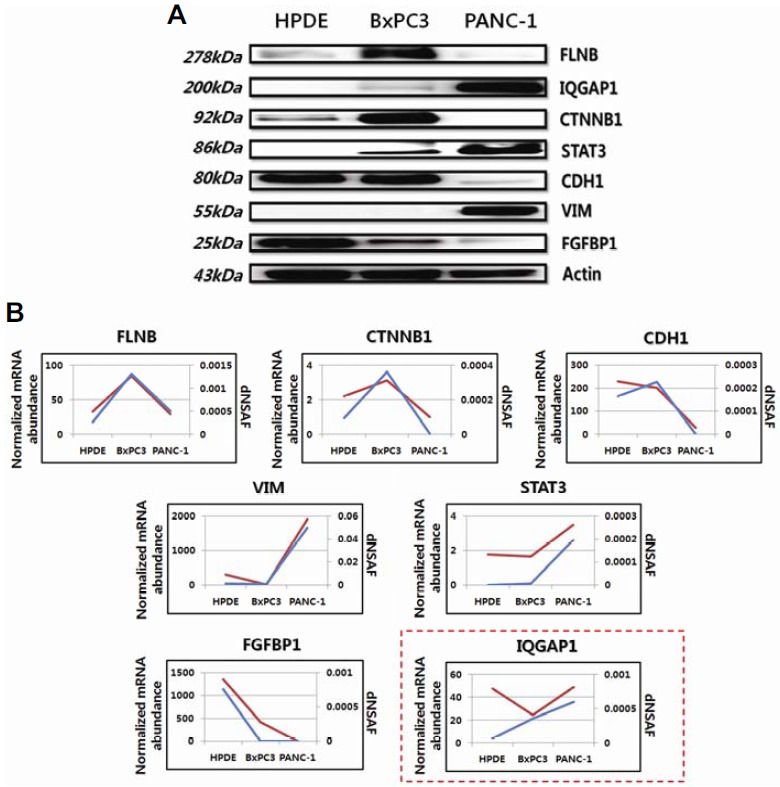
Fig. 4.

Western blotting and comparisons between genomic and proteomic data. (A) Western blotting to validate the label-free quantitation results. Actin was used as a loading control. Expression patterns of seven proteins (FLNB, CTNNB1, VIM, CDH1, IQGAP1, FGFBP1, and STAT3) for each cell line in Western blot assays were consistent with the label-free quantitation results. (B) A comparison between proteomic and genomic expression patterns of proteins measured in (A). In each plot, the blue and red lines indicate proteomic and genomic data, respectively. The expression patterns of 6 proteins (FLNB, CTNNB1, VIM, CDH1, FGFBP1, and STAT3) for each cell line were correlated with the genomic data, except for IQGAP1 (red-box). The y-axis represents normalized mRNA abundance for genomic data and dNSAF values for proteomic data.
