
Fig. 1.
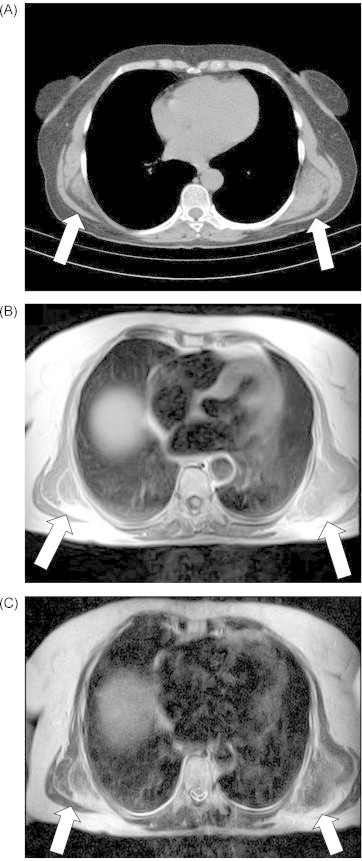
(A) Computed tomography scan shows elastofibroma typical placement of bilateral periscapuler region. Axial T1-weighted MR images: (B) axial T-2 weighted MR images. (C) Magnetic resonance scan of both mass with striated appearance and multiple linear septae of alternating high and low signal intensity due to the interlacing of linear streaks of fat.