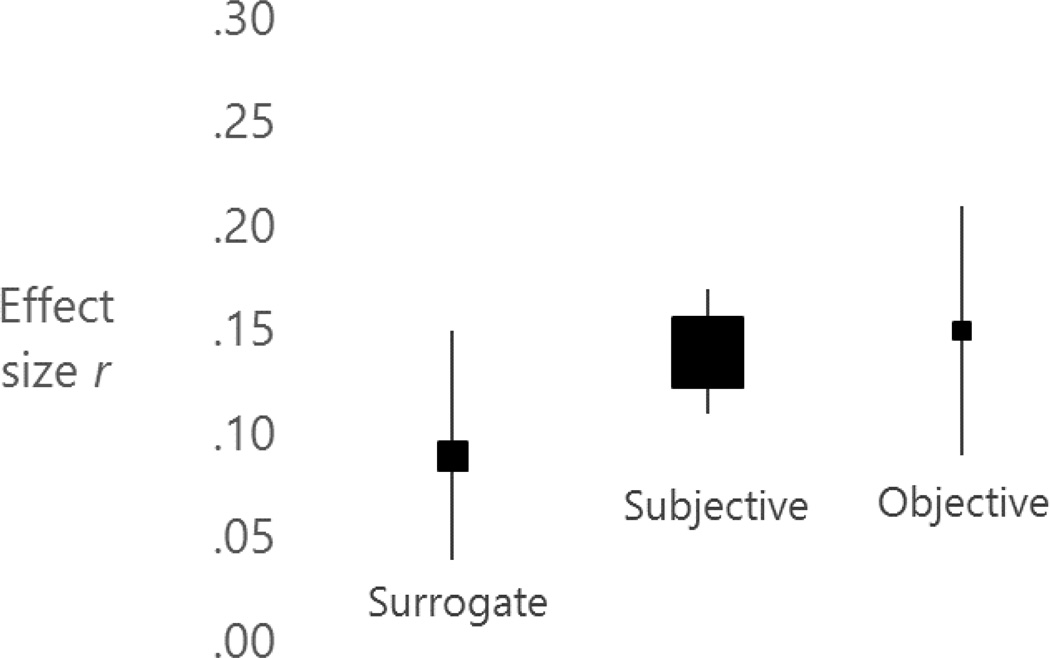
Figure 2.
Summary of effect sizes in the Robles et al. (2014) meta-analysis. Effect sizes are depicted as the correlation coefficient r, which ranges from −1.00 to +1.00. Positive values indicate that greater marital quality is related to better physical health. The size of the squares is proportional to the number of studies in each category. The height of the vertical bars indicates the 95% confidence interval around the effect size, which is the range of average effect sizes one would expect in 95 out of 100 future meta-analyses.

