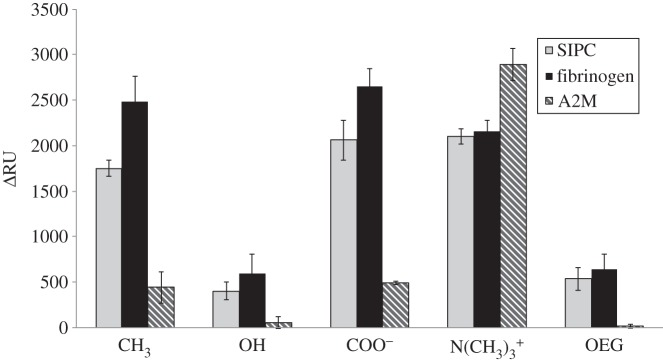
Figure 1.

SPR data for the adsorption of fibrinogen, SIPC and α2-macroglobulin (A2M) on a series of SAMs. Data are absolute changes in resonance units (ΔRU) after a 3 min injection of 0.1 mg ml–1 protein solutions at pH 8.3, at 10 µl min–1 flow rate and 25°C, followed by 5 min 0.05 M Tris-base buffer wash. Standard errors were from three replicate SPR experiments.
