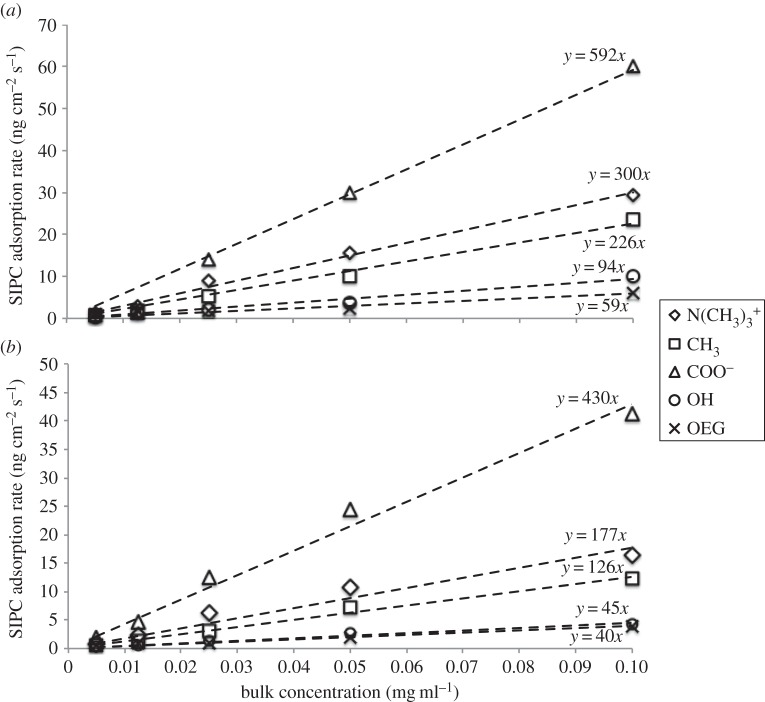
Figure 7.
SIPC adsorption rates during (a) t1–t2 and (b) t1–t5 intervals for five SIPC bulk concentrations (0.1, 0.05, 0.025, 0.0125 and 0.005 mg ml−1) on the SAMs reported in the legend. Linear fits to the rates for each SAM are reported by the dashed lines along with their corresponding equations.

