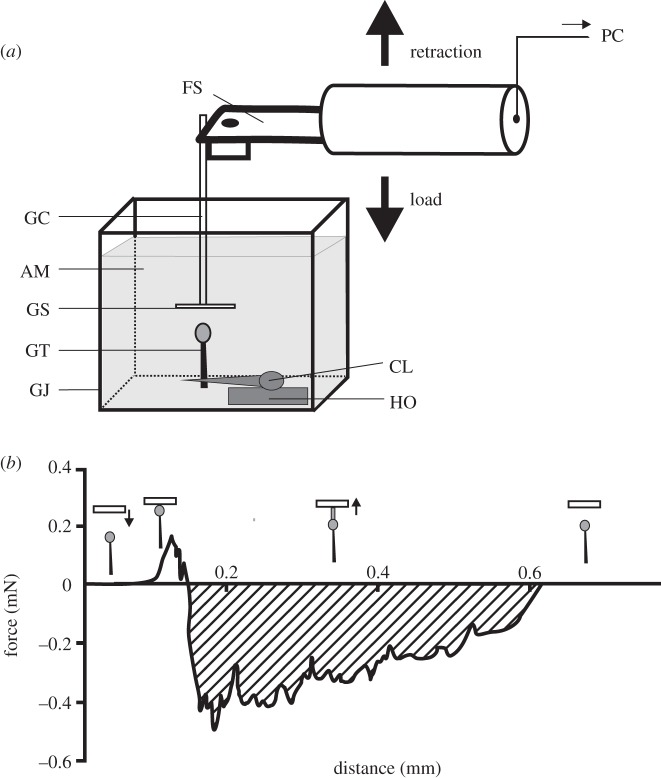
Figure 1.
Force measurements. (a) An experimental design for measuring underwater adhesion of single trichomes of R. gorgonias. The fresh trichome (GT) was perpendicularly clamped (CL) and mounted on a horizontal holder (HO). A force sensor (FS) with a firmly adhering glass capillary (GC) and attached glass slide (GS) was moved down, using a motorized micromanipulator, until the contact between the GS and the secretion of the GT was established. Then the sensor with the secretion adhering to the GS was pulled off. The force–time signal was recorded and processed further in a computer (PC). A glass aquarium (GJ) was filled with Aqua Millipore water (AM) during underwater measurements. (b) Representative force–distance curve, transformed from obtained force–time curve. It displays a transition at 0.2 mm which indicates that instabilities have developed in order to relieve the force. Insets show the trichome position relative to the glass slide at each part of the force–distance curve. Arrows point to the direction of the substrate movement. The shaded area indicates the work that had to be applied to retract the adhering trichome from the surface.

