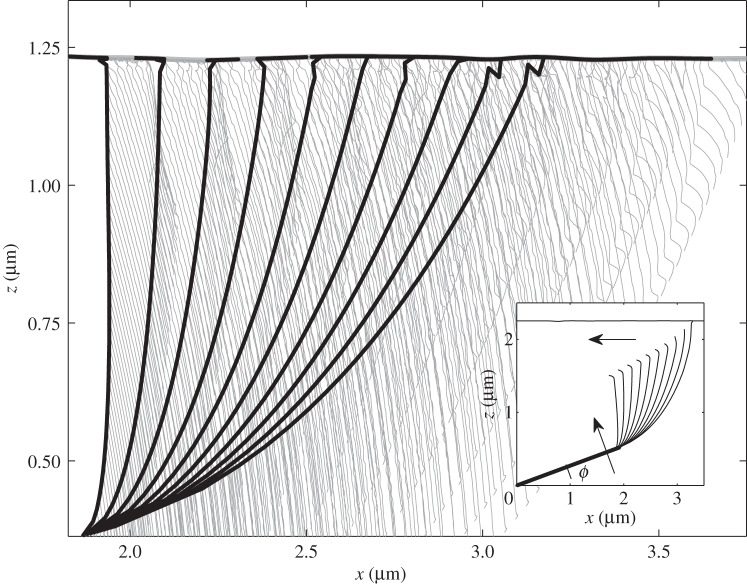
Figure 3.
Conceptual picture of the model in two-dimensional plane {x, z}. The fibres and their trajectories are shown by bold black and thin grey lines, respectively. Initial configuration is presented in the inset. The arrows show additional directions of the motion, which appear owing to the attraction of the fibres to the surface: rotation of the rigid root (seta) and shear along x-coordinate. Parameters for modelling were U0 = 10 nN nm, r0 = 0.002 µm, A = r0 and elasticity K = 47.1 mN m−1.

