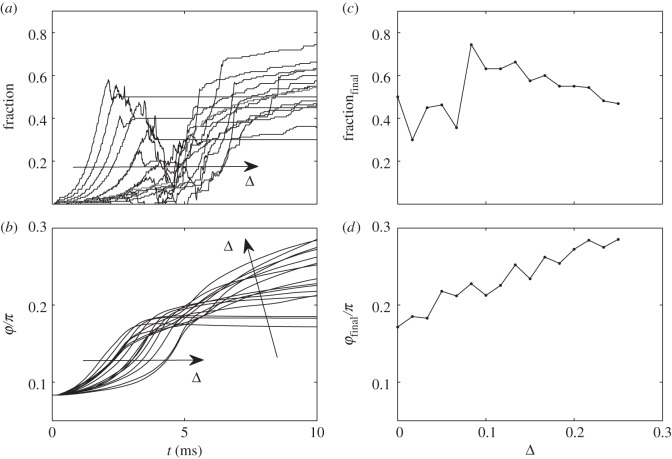
Figure 5.
Time-depending fraction of the attached fibres and angle φ for interacting fibres, reproduced in the subplots (a) and (b), respectively. Final values of the fraction and angle, calculated at different shift Δ, are shown in the subplots (c) and (d), respectively. The tendencies with variation of Δ in the time-depending plots are marked by the arrows.

