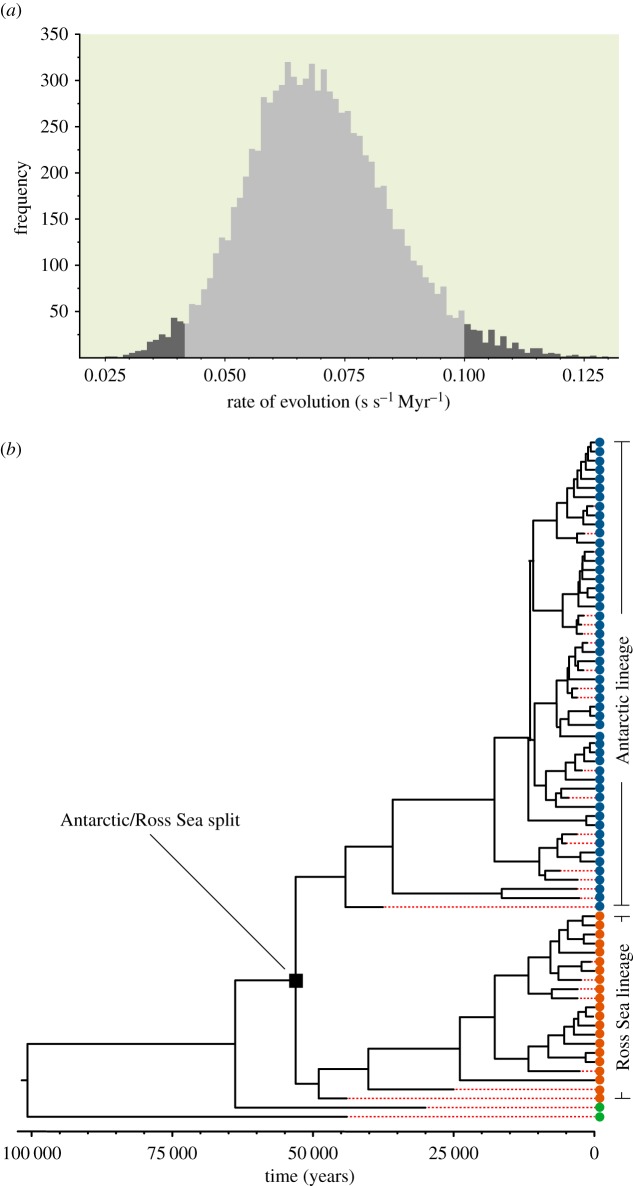
Figure 4.
Molecular rates for mitochondrial sequences and times of divergence of mitochondrial lineages. (a) Posterior distribution of rates of evolution estimated using a relaxed log normal molecular clock and the HKY + gamma model of evolution. (b) Bayesian chronogram showing divergence/coalescence times among modern and ancient Adélie penguin populations used in this study. Dotted horizontal lines denote cessation of branch lengths corresponding to the ages of samples. (Online version in colour.)

