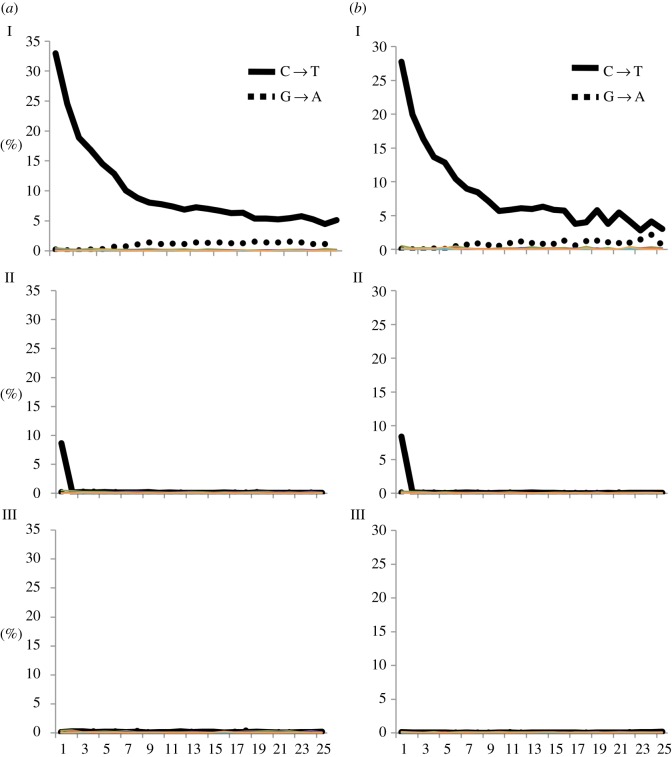
Figure 2.
Damage profile of the terminal 25 nucleotides of two samples ((a) I–III) and ((b) I–III) treated in three different ways during library preparation: I, no UDG treatment; II, partial UDG treatment; III, full UDG treatment. The frequencies of all possible substitutions are plotted as a function of the distance from the 5′ end (average of the 5′ end and reverse complement of the 3′ end; between 1 and 25 bp on the x-axis) for all unique endogenous reads. Predominant substitution patterns (C → T and G → A) are highlighted. (Online version in colour.)

