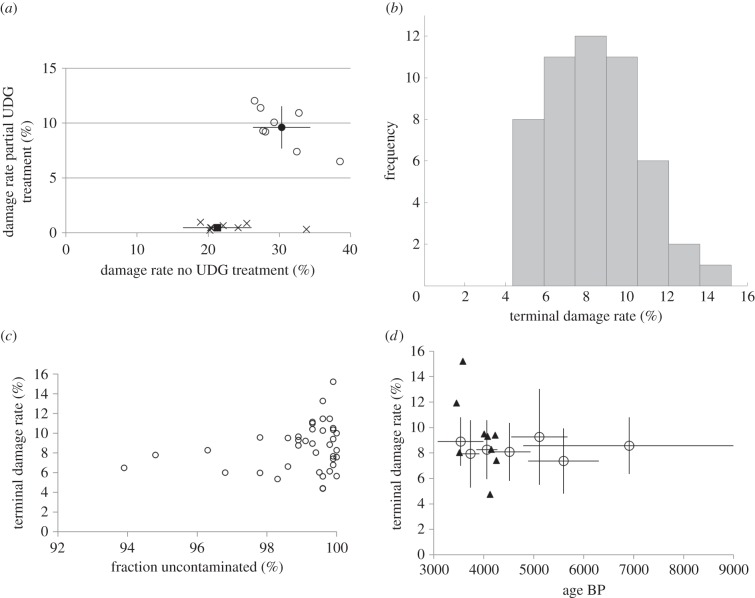
Figure 3.
Partial UDG treatment (a) damage pattern in terminal bases (circles) and penultimate bases (crosses) for eight samples when libraries from the same extract were prepared without UDG-treatment (x-axis) and with partial UDG treatment (y-axis); average is shown in filled markers with 1 s.e. bars. The median reduction is three times for terminal bases and 26× for penultimate bases. (b) Histogram of terminal damage rate of 51 libraries prepared with the partial UDG treatment with average mitochondrial coverage >2.0×. (c) Terminal damage rate as a function of contamination estimate using reads aligning to the mitochondrial reference for all libraries prepared with the partial UDG-treatment protocol with coverage of >10× on the mitochondrial genome. (d) Terminal damage rates as a function of sample age for all partially UDG-treated libraries. Samples of similar age were grouped together and bars show 1 s.e.; triangles show results for individual samples with direct 14C dates.

