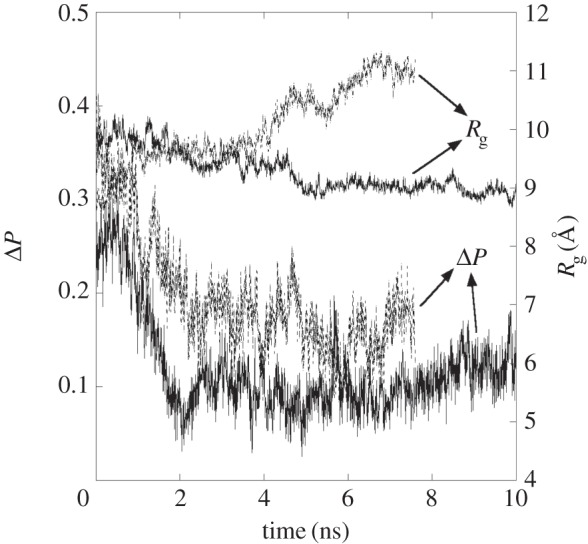
Figure 2.

Double y-axis plot of the order parameter difference, ΔP (left scale) and radius of gyration (right scale) of polyethylene nanoparticles with respect to time. The solid lines represent the PE-1 system, while the dotted lines represent the PE-2 system.
