Figure 4.

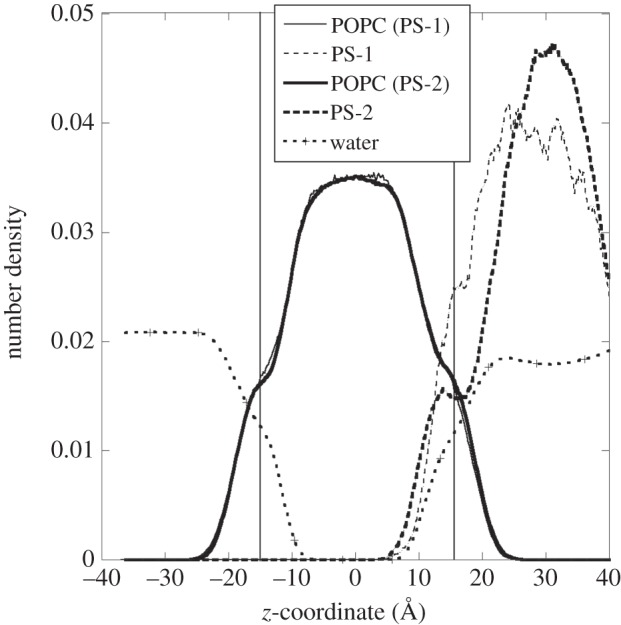
Number density profile along the z-direction of various molecular components for PS-1 (thin lines) and PS-2 (bold lines) molecular systems. The two vertical lines indicate the average positions of the POPC phosphate groups.

Number density profile along the z-direction of various molecular components for PS-1 (thin lines) and PS-2 (bold lines) molecular systems. The two vertical lines indicate the average positions of the POPC phosphate groups.