
Figure 9.
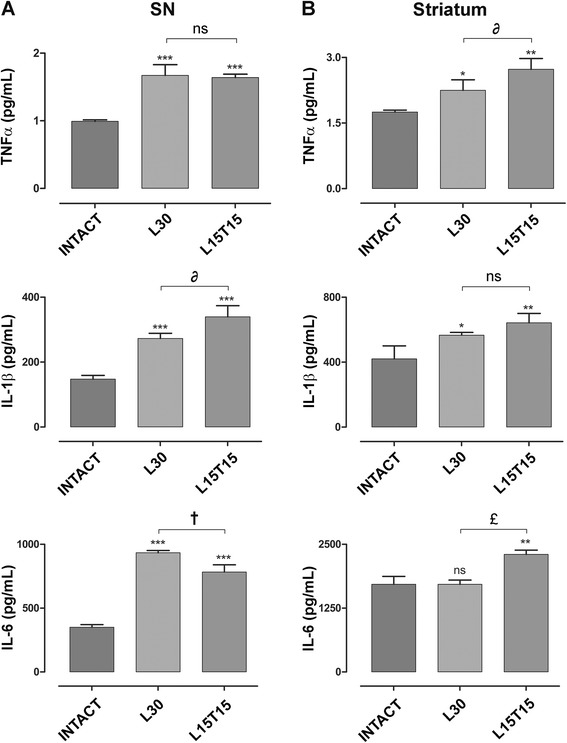
Protein levels of inflammatory cytokines in the nigrostriatal system. Graphs showing the protein levels of TNF-α, IL-1β, and IL-6 using indirect ELISA in the substantia nigra (SN) (A) and in the striatum (B). ns = not significant, *P < 0.05, **P < 0.01, ***P < 0.001 when compared with the intact condition. ∂ = P < 0.05, † = P < 0.01, £ = P < 0.001 when compared with L30. One-way ANOVA with Newman-Keuls post hoc test. n = 4 different rats for each condition.