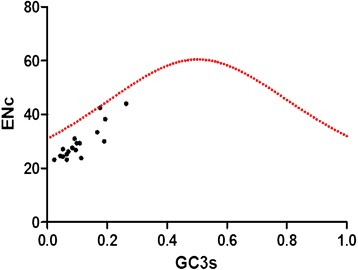
Figure 5.

ENc analysis of each gene plotted against GC3s. The standard curve in red point in the figure showed the functional relation between ENc and GC3s is under mutation pressure without selection. Points on or close to the curve means bias caused by mutation pressure. Otherwise, they are affected by natural selection or other factors.
