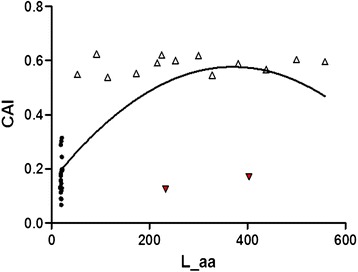
Figure 6.

CAI against gene length (L_aa value) of the coding genes. The regression curve can be described as y = −3 × 10−6x2 + 0.0023x + 0.1514, R2 = 0.5694. The black point, white up triangle, and red triangle refer to tRNA gene, coding protein and rRNA gene respectively.
