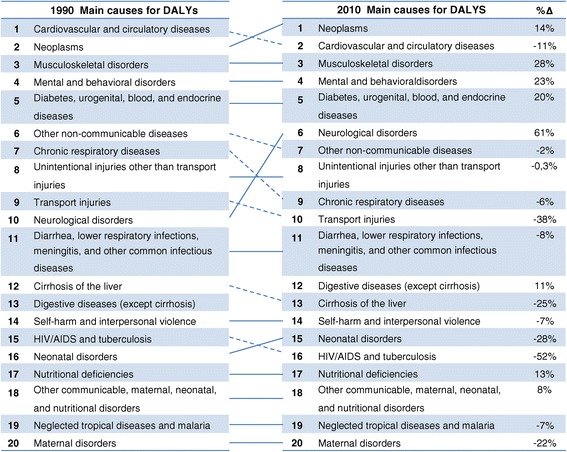
Figure 3.

Spanish disability-adjusted life years (DALYs) ranks for the top 20 main causes in 1990 and 2010, and the percentage change between 1990 and 2010. Continuous line represents an ascending order in rank and the broken line represents a descending order. (Δ%) = % of change in absolute numbers of DALYs.
