
Figure 2.
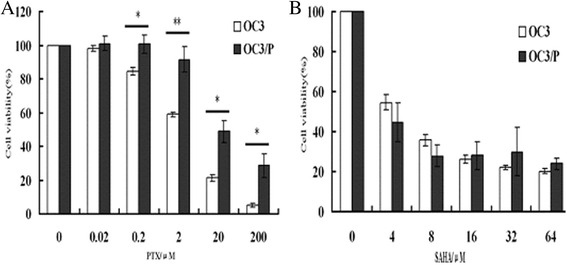
Viability of OC3 and OC3/P cell lines treated with PTX or SAHA. A: Viability of OC3 and OC3/P treated with various concentrations of PTX for 24 h. **P <0.01, *P <0.05. B: Viability of OC3 and OC3/P treated with various concentrations of SAHA for 48 h. No significant differences were observed between OC3 and OC3/P cell viability at any of the dose (P >0.05), implying that OC3/P is not cross-resistant to SAHA. Data represents the mean of three independent experiments. Error bars indicate one standard deviation from the mean.