Figure 8.

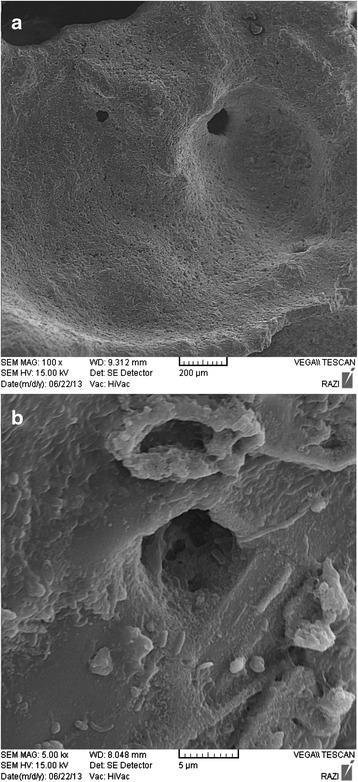
SEM micrographs of (a) raw scoria (×100) and (b) filter bed taken from 3 rd section at the end of biofilter operation (×5000).

SEM micrographs of (a) raw scoria (×100) and (b) filter bed taken from 3 rd section at the end of biofilter operation (×5000).