Figure 6.

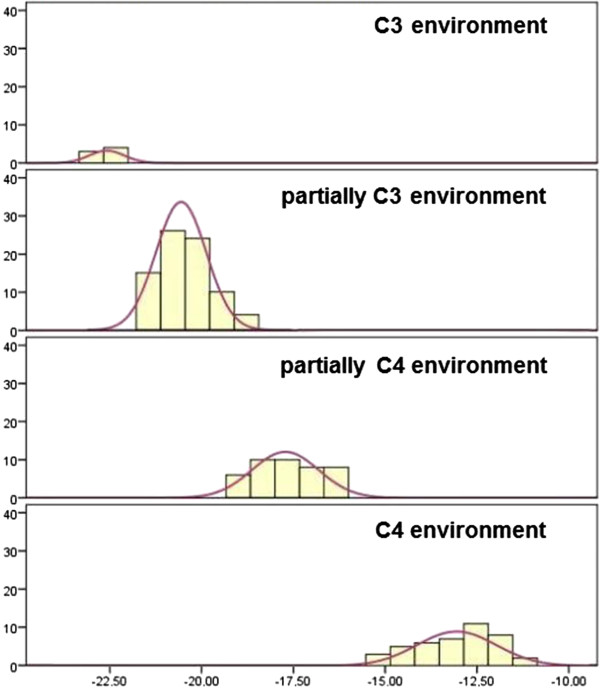
Histogram displaying δ 13 C values in 170 rattle segments from the snakes studied, according to the distribution of their environments. C4: C4 environment, PC4: partially C4 environment, C3: C3 environment, PC3: partially C3 environment.

Histogram displaying δ 13 C values in 170 rattle segments from the snakes studied, according to the distribution of their environments. C4: C4 environment, PC4: partially C4 environment, C3: C3 environment, PC3: partially C3 environment.