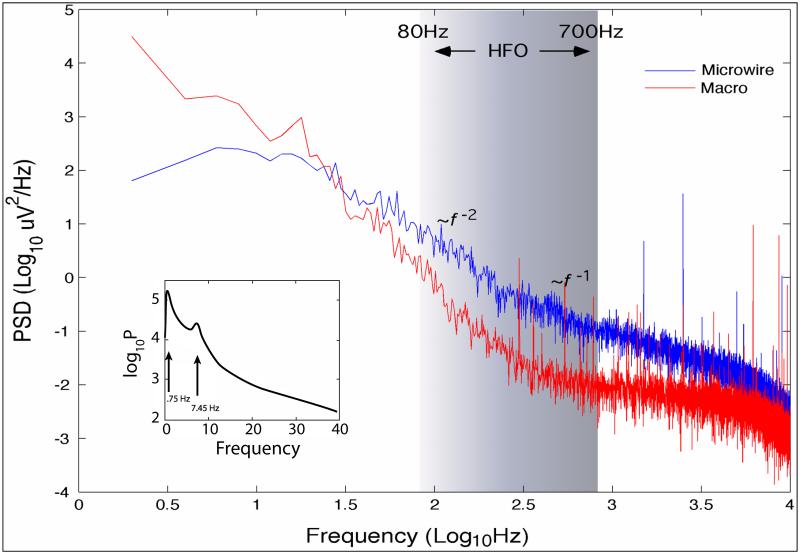
Figure 2.
Power spectral density (PSD) from 5 minutes of human hippocampus during sleep recorded with intracranial EEG (0.05 - 10,000 Hz, sampled at 32 kHz) using micro- and clinical macro- electrodes. The wide bandwidth recording exhibits 1/f β behavior with different scaling regions characterized by different scaling exponents β = 1 and 2. The inset shows an expansion of the PSD in the 0.05 - 40 Hz range and spectral peaks from a low delta frequency oscillation (~ 0.75 Hz) and a theta-alpha frequency oscillation (7.45 Hz). The characteristic 0.75 Hz oscillation is persistent throughout the 5 minutes and modulates the 7.45 Hz intermittent oscillation. (Unpublished Data)

