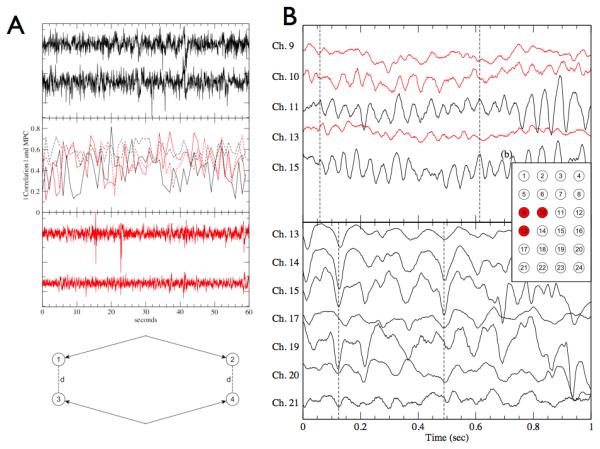
Figure 3.

Data and from 2 patients, one with intractable facial pain (black) and other with focal epilepsy (gray). Data from the patient with intractable facial pain and no history of seizures serves as a control recording for quantitative comparison. A) (a) Sample signals from two electrodes of the control brain recording. (b) The correlation magnitudes (solid lines) and mean phase coherence (dashed lines) of the signal pairs in (a) and (c). Both the correlation and mean phase coherence (MPC) show significant temporal variability over the course of 60 seconds, with values primarily ranging from (0.2 - 0.7) (c) Sample signals from two electrodes in epileptic cortex outside the seizure onset zone. (d) A sample layout of the bipolar reference pair measurement. The distance between one corresponding pair of electrodes 1 and 3 is equal to the distance between the other pair, electrodes 2 and 3, and this is the distance referenced in our bipolar measurements (Fig. 3). B) Sample interictal iEEG signals from Patient 1 with epilepsy from both inside the seizure onset zone (SOZ), shown in gray, and near signals outside the SOZ (black). Dashed line marks significant phase lag between inside and outside the SOZ. (b) Spatial layout of the intracranial electrodes for Patients 1 and A with the SOZ electrodes (9, 10 and 13) of Patient 1 shown in red. (c) Sample signals from the control Patient A. The spatial numbering is as shown in (b). For clarification, signals are offset vertically. (Reproduced from Warren CP et al. J Neurophysiol 2010, Dec;104(6):3530-9)
