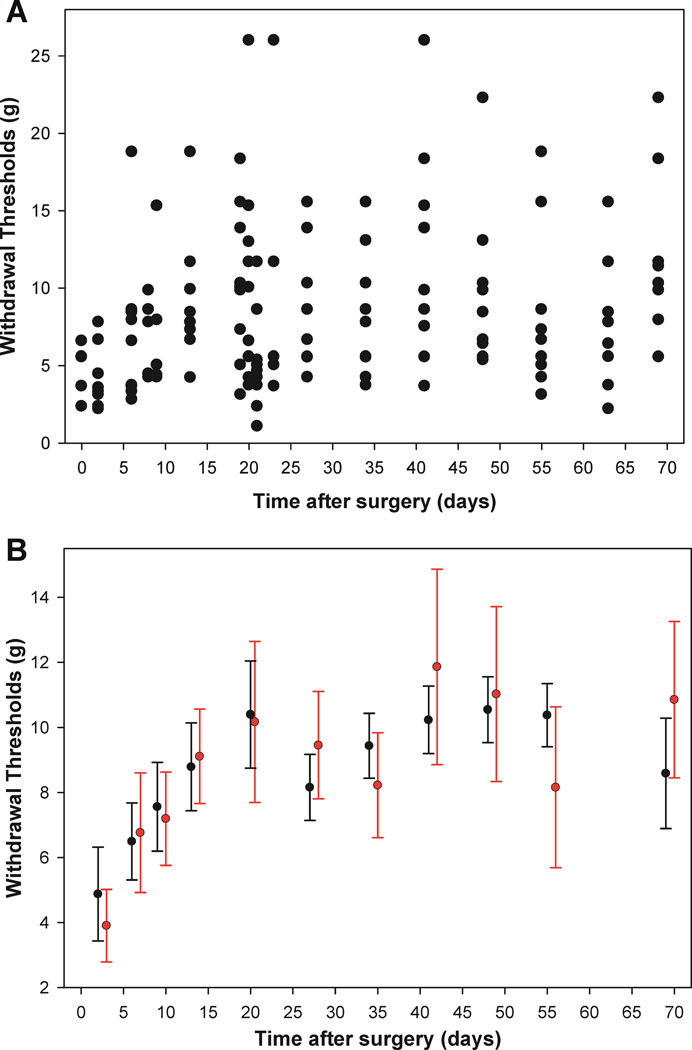
Figure 5.
A)Scatterplot of actual withdrawal thresholds for the postpartum-with-pups group only demonstrates the large degree of variability observed across subjects. B) The predicted withdrawal thresholds with 95% confidence intervals for both the growth curve model (black) and two-way RM ANOVA model (red) for the postpartum-with-pups group only. The reduction in confidence interval width in the growth curve model illustrates greater precision in the estimates than in the two-way RM ANOVA model.

