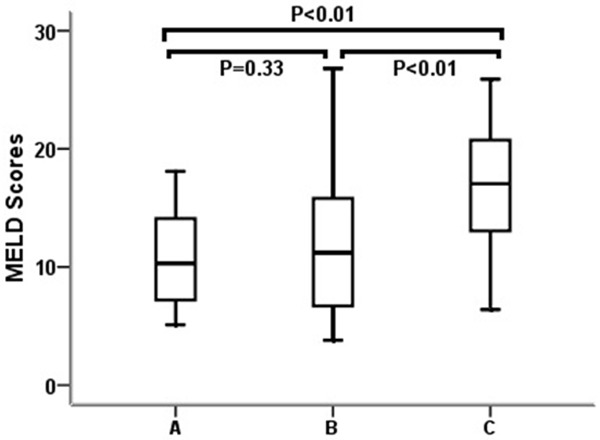
Figure 3.

Comparisons of the MELD scores among the patients with various MPVs. Patients were divided into three groups based on MPV levels: groups A (≤10 fl), B (>10 fl, but <12 fl) and C (≥12 fl). Data are expressed as box plots, in which the horizontal lines illustrate the 25th, 50th, and 75th percentiles of the MPV levels. The vertical lines represent the 5th and 95th percentiles. The P values for multiple comparisons were calculated using the nonparametric Kruskal-Wallis test.
