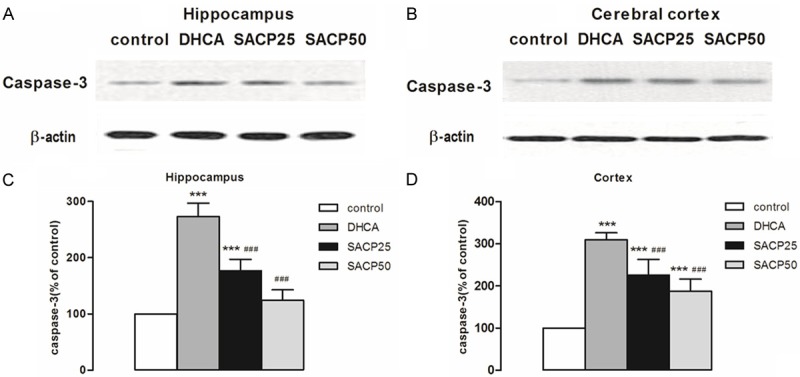
Figure 4.

Expression levels of caspase-3. The pattern of caspase-3was evaluated by Western blot analysis in samples taken from the hippocampus and cerebral cortex, as described in Materials and methods. A, B. SACP-induced changes in the pattern of caspase-3 in samples derived from the hippocampus and cerebral cortex, respectively. β-Actin served as loading control. C, D. Quantification of caspase-3 intensities after SACP in the hippocampus and cerebral cortex respectively. Quantification data are presented as means ± SD. ***p < 0.001 compared to control group, ###p < 0.001 compared to DHCA group (ANOVA, followed by Fisher’s protected least-significant difference (PLSD) test).
