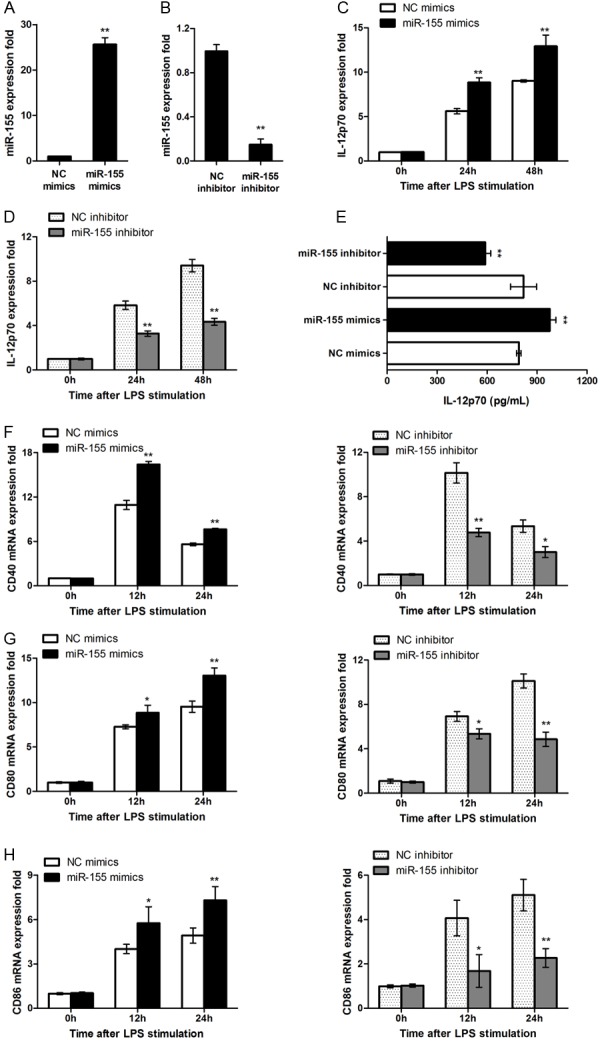
Figure 2.

miR-155 regulate DCs phenotype and cytokine production. (A) A total of 0.5 ml 5 × 10⁵ DCs were transfected with control mimics or miR-155 mimics. After 48 h, miR-155 level was measured by qRT-PCR and normalized to that of U6 in each sample. (B) DCs were transfected with control inhibitor or miR-155 inhibitor, miR-155 level was measured by qRT-PCR 72 hrs after transfection. (C, D) DCs were transfected with miR-155 mimics, inhibitor or ctrl, IL-12p40 mRNA expression were measured by qRT-PCR. (E) IL-12p70 level was measured by ELISA. (F-H) DCs were transfected as in (C, D), after stimulating by LPS for indicating time, CD40, CD80 and CD86 mRNA expression was measured by qRT-PCR. Data are shown as mean ± SD (n = 3) of one representative experiment. Similar results were obtained in three independent experiments. **p < 0.01; *p < 0.05.
