
Figure 3.
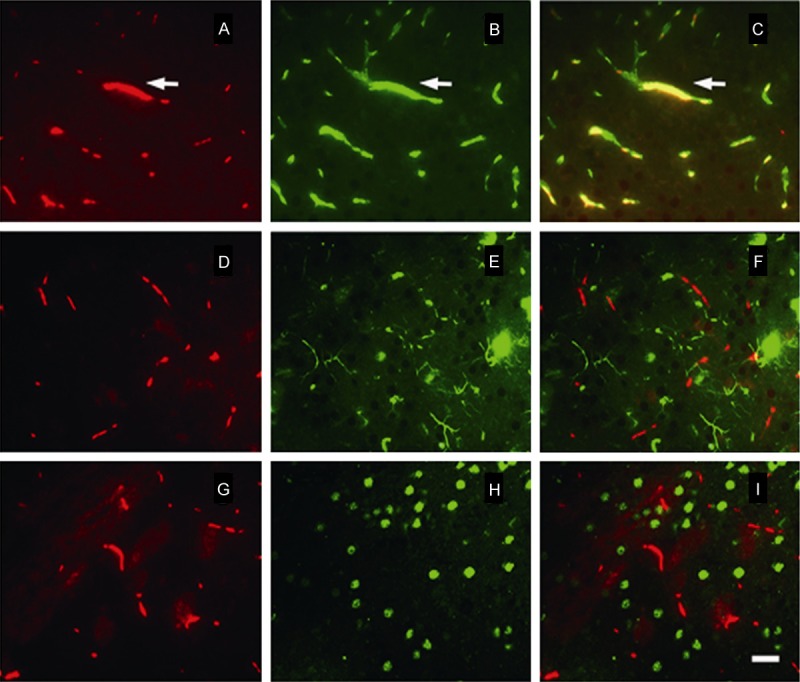
Photomicrographs of double-immunofluorescence staining of adiponectin expression in ischemic brain tissue. Red represents adiponectin; the green represents VWF, GFAP, and NeuN; orange represents the overlapping of red and green; A, D, G. Adiponectin-specific immunoreactive signals; B. VWF immunoreactive signal; E. GFAP immunoreactive signal; H. NeuN immunoreactive signal; bar = 50 μm.