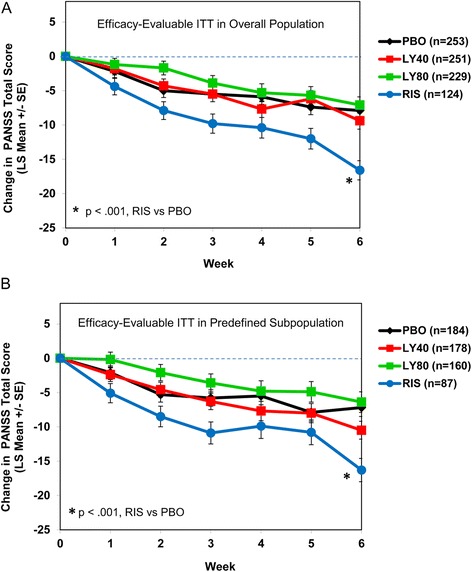
Figure 4.

Plot of weekly least-squares mean (+/−standard error [SE]) of efficacy measures by treatment. Repeated measures analysis of change from baseline to each postbaseline visit (MMRM), efficacy-evaluable intent-to-treat patients in the overall population (A) and in the predefined subpopulation (B). In the figures, Week 0 corresponds to study Visit 3, and Week 6 corresponds to study Visit 9.
