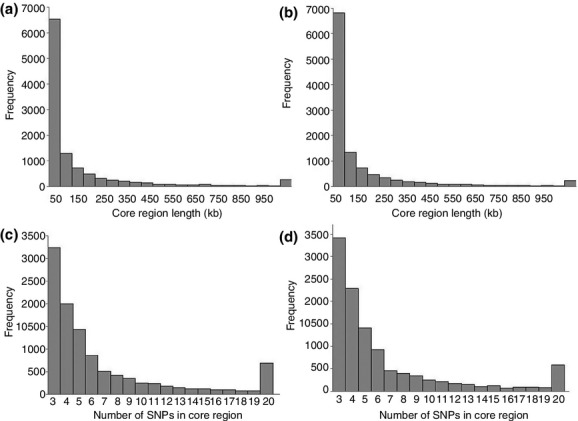
Figure 1.

Distribution of length of core regions and the number of SNPs forming the core regions in Yorkshire and Landrace. (a) and (b) show the distribution of length of core regions, separately, in Yorkshire and Landrace respectively. The Y-axis represents frequency, and the X-axis represents the length of core regions. (c) and (d) show the distribution of the number of SNPs forming the core regions, separately, in Yorkshire and Landrace respectively. The Y-axis represents the frequency, and the X-axis represents the number of SNPs.
