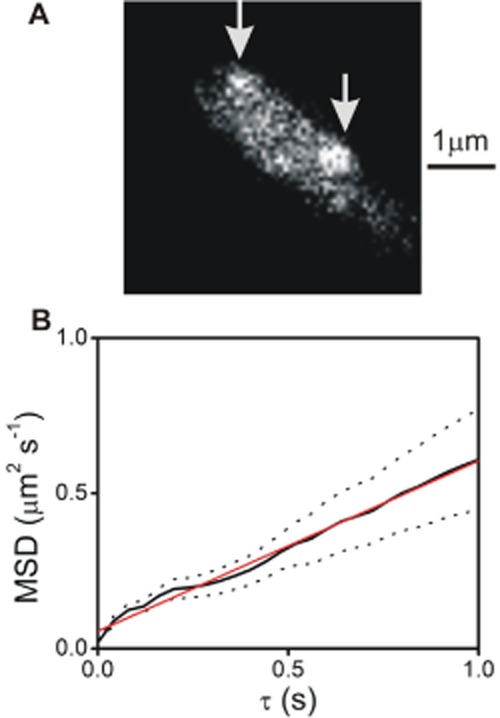
Figure 6.

TIRF imaging and single particle tracking.
A. TIRF image of E. coli cell expressing helix1021-GFP, with positions of two detected particles indicated (arrows). See also Movie S1.
B. Mean-squared displacement as a function of time interval τ taken from the average of nine individual tracked particle trajectories of ‘long’ duration of at least 1 s (solid line), with standard error bounds indicated (dotted lines), and linear fit (red), indicating an effective mean diffusion coefficient (± SD) of 0.14 ± 0.02 μm2 s−1 (as compared with a mean of ∼ 0.2 μm2 s−1 calculated using all trajectory data irrespective of duration length). Note this is marginally higher due to lower stoichiometry trajectories having a faster effective diffusion coefficient but photobleaching faster and thus lasting less than 1 s).
