
Figure 2.
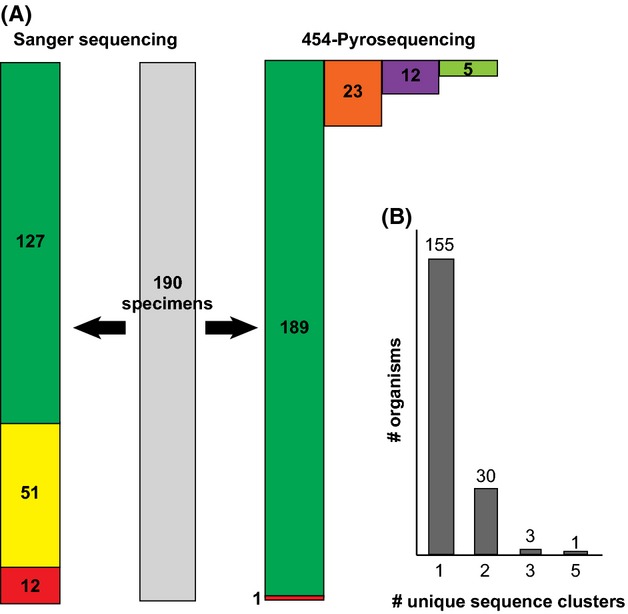
Comparison of DNA sequence data recovered by Sanger sequencing and 454 pyrosequencing. A) Green bars represent number of full-length COI barcode sequences. Yellow bar represents number of partial COI barcode sequences. Red bars represent failed target barcode attempts. Orange bar represents number of heteroplasmic COI sequences. Purple bar represents number of coamplified nontarget COI sequences (i.e. ‘contaminants’). Light green bar represents number of Wolbachia sequences. B) Number of organisms recovering single or multiple sequence clusters during 454 pyrosequencing.