
Figure 3.
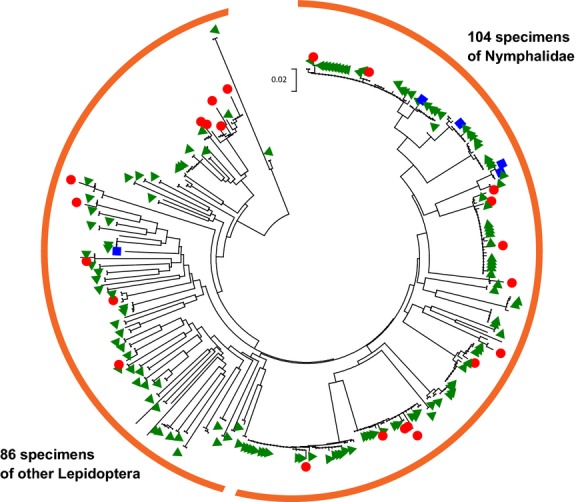
Neighbour-joining diagram of 352 DNA sequences recovered by 454 pyrosequencing and Sanger sequencing. Short sequences (<600 bp) have not been included. Distance measurement is calculated in number of base substitutions per site based on the Kimura 2-parameter method. The tree backbone represents the 454 pyrosequences and green triangles represent sequences produced by Sanger sequencing (>600 bp). Red circles represent sequences determined to be heteroplasmic. Blue squares represent individual specimens that also recovered a Wolbachia sequence.