
Figure 1.
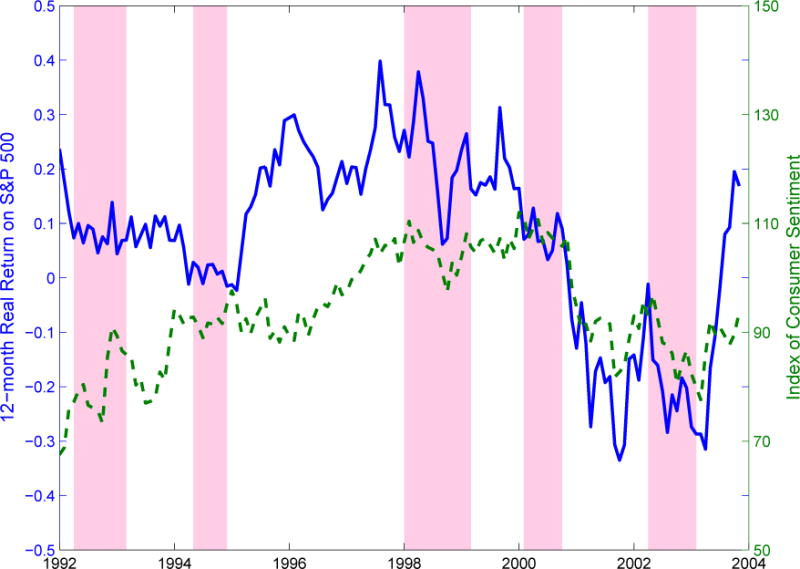
Stock Market Returns and Consumer Sentiment, 1992 – 2004
NOTE: The solid line is the total annual return from the S&P 500 Total Return Index (including dividends) over the previous 12 months. The monthly value of the S&P 500 Index is the closing value on the last business day of the month. The index from Global Financial Data is adjusted for dividends and splits. The CPI-U removes general price inflation from the return. The dashed line is the current monthly value of the Index of Consumer Sentiment from the University of Michigan Survey of Consumers. The shaded areas denote months in which the HRS fielded the income gambles. These interview months for the five waves are 4/1992 to 3/1993, 5/1994 to 12/1994, 1/1998 to 3/1999, 2/2000 to 11/2000, and 4/2002 to 2/2003.