Figure 7.
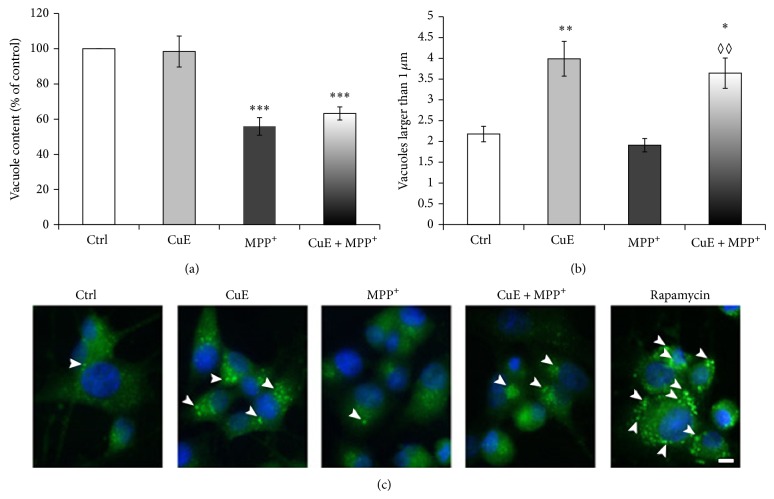
Epifluorescence analysis of autophagy in neuronal PC12 cells treated with CuE and/or MPP+ using Cyto-ID autophagy detection kit. (a) Histogram. Total content of vacuoles positive for Cyto-ID. CuE administration could not change the total number of vacuoles while MPP+ considerably decreases cellular vacuole content. (b) Histogram. Number of vacuoles larger than 1 μm per cell. Administration of CuE alone clearly induces an increased number of larger than 1 μm vacuoles. Administration of MPP+ intensely reduces the presence of these large vacuoles. Pretreatment with CuE before MPP+ (CuE + MPP+) still shows similar levels of large vacuoles as in CuE-alone treatment. (c) Fluorescent microscopy. CuE-treated cells show an increased number of autophagic vacuoles larger than 1 μm (arrowheads). Positive control for autophagy was rapamycin, a known autophagy inducer. Nuclei were counterstained in blue with Hoechst 33342. Scale bar = 10 μm. Data are expressed as number of vacuoles larger than 1 μm per cell and are means ± S.E.M. n = 3. ** P < 0.01 and * P < 0.05 versus Ctrl. ◊◊ P < 0.01 versus MPP+ and n.s. = nonsignificant.

