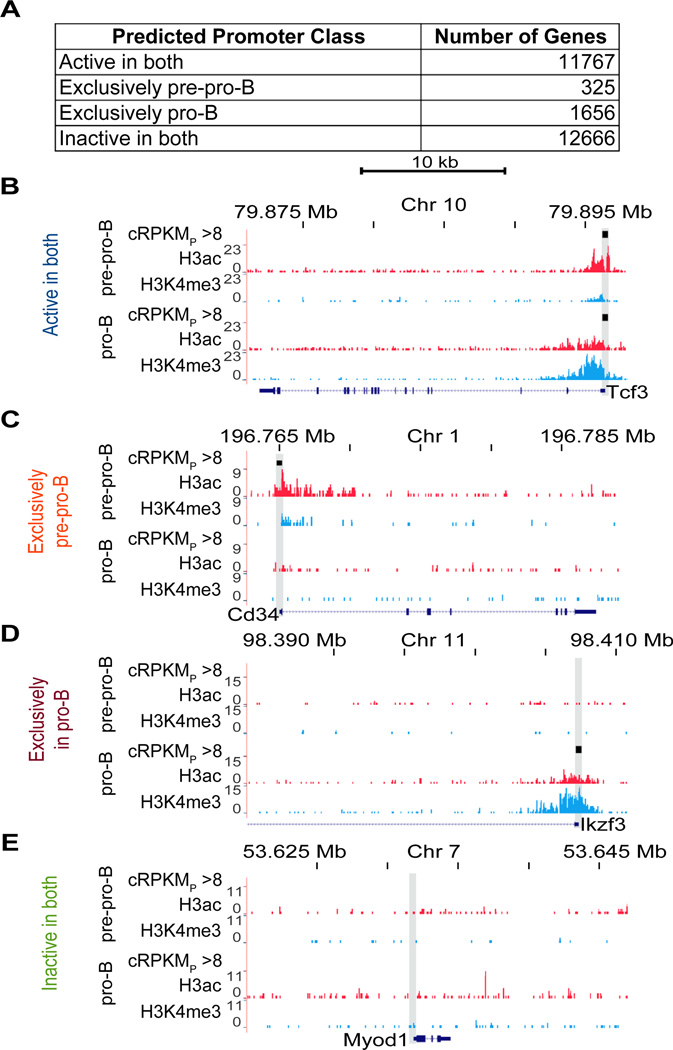
Figure 3. Representative genes in predicted promoter classes.
(A) Numbers of genes in the four predicted promoter classes: ‘active in both’, ‘exclusively pre-pro-B’, ‘exclusively pro-B’, and ‘inactive in both’. (B–E) An example of a gene in each of the four predicted promoter classes: Tcf3 (B), Cd34 (C), Ikzf3 (D), Myod1 (E). Each panel shows the H3ac (red) and H3K4me3 (blue) abundance for the indicated locus in each cell line. Promoters with cRPKMP > 8 are indicated by black bars. Directional tick marks on the gene depictions indicate direction of transcription. The tall shaded boxes indicate the promoter regions of each gene. Genomic coordinates correspond to the most distal tick marks.

