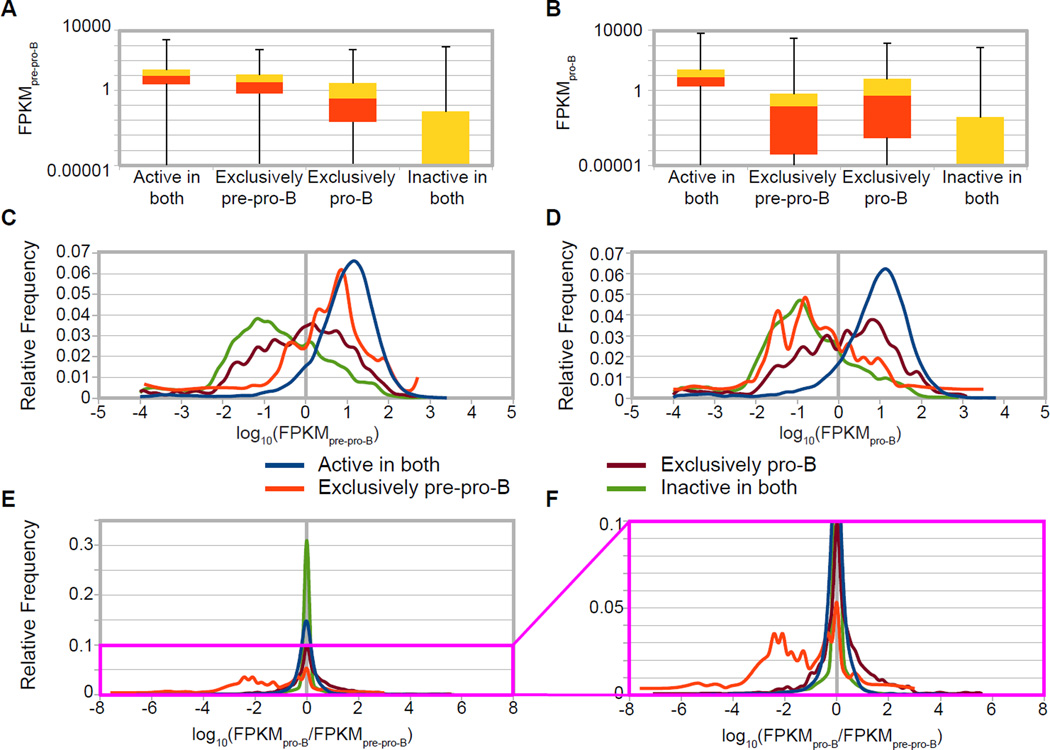
Figure 5. Relationship between predicted promoter classes and steady state mRNA levels.
(RNA-seq) (A and B) Genes categorized based on their predicted promoter class (‘active in both’, ‘exclusively pre-pro-B’, ‘exclusively pro-B’, and ‘inactive in both’) are shown in a box and whiskers plots representing the quartiles of RNA-seq values plotted versus RNA-seq transcription levels (FPKM on a log10 scale) in pre-pro-B cells (A) and pro-B cells (B). In these representations, all protein-coding genes in RefSeq are considered, including genes with FPKM = 0. (C and D) Graphs showing the relative frequency distribution of RNA-seq transcription levels [log10(FPKM)] for each predicted promoter class (see color key) in pre-pro-B cells (C) and pro-B cells (D). (E and F) Graphs showing the relative frequency distribution of the differential ratio of RNA-seq steady state mRNA levels [log10(FPKMpro-B/ FPKMpre-pro-B)] for each predicted chromatin class, with the magenta box of (E) magnified in (F). In these representations, frequency was assessed at increments of 0.1 of the log10 converted transcription level (C and D) or calculated differential (E and F), and genes with RPKM = 0 are not included (C–F). All classes demonstrated statistically significant differences (WMW p <0.0001).

