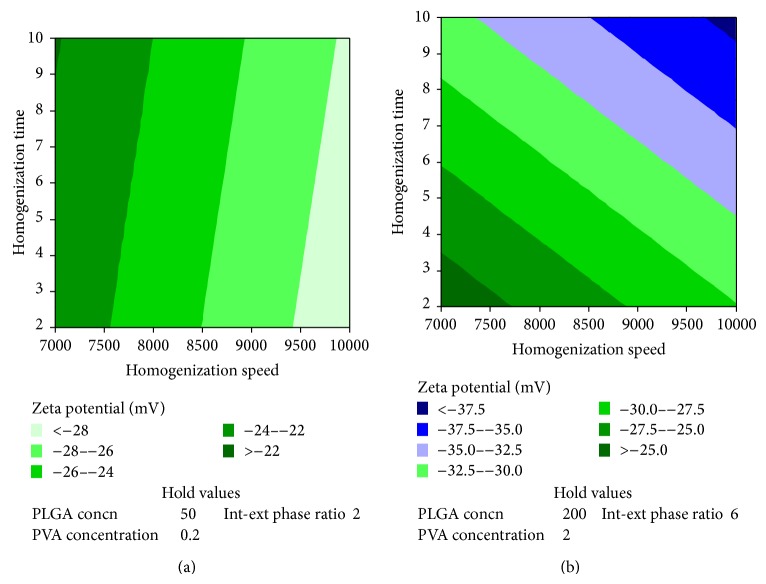
Figure 4.
Contour plot showing the effect of independent variables on zeta potential. (a) Effect of various levels of homogenization speed and homogenization time on zeta potential when the levels of other variables are maintained at low levels. (b) Effect of various levels of homogenization speed and homogenization time on zeta potential when the levels of other variables are maintained at high levels.

